Part 8. Addendum - New Features added since 7.4
TradingExpert Pro is compatible with WIndows Vista 32-bit version
Powerful new AIQ Charts Features
Chart Pattern Recognition add-on service.
Synchronized Exploring
Ability to have multiple charts of the same ticker all change when exploring in a list. Includes real-time, daily, weekly, monthly.
Delete all attributes in Chart
Ability to have all attributes for a chart be deleted dynamically while charts are open (no ticker reopen required).
Overlaying price history from the past on a current chart, e.g overlay the bottom from DOW 70's bear market over current Dow price.
Overlay two charts in real time.
Create a spread between 2 tickers, real time or end of day.
New Print Features - Screen Print and Screen Print (Fit to Page)
New Chart Preferences item to left or right justify the title text in the chart
Real-time charts show change from prior days close dynamically.
Get a whole new view with AIQ Charts by decreasing spacing to the minimum.
Monthly chart now available.
New composite data for real-time charts.
Save your charts layout so that next time on entering charts the same charts appear.
Comparison charts compare multiple charts of any ticker in a percentage change format.
Overlay indicators on price chart - You can now display an indicator like MACD, Volume, Stochastic etc directly to the price chart.
Expert Design Studio
EDS Back Test Real Time - requires saving of real-time historical data in the Data Manager.
New Indicator Fields
For all indicators that incorporate support lines, support line fields have been added. For example, two new fields are available for MF RSI: [MF RSI Lower Support Line] and [MF RSI Upper Support Line].
New Built-in Function - Trendline Breakout().
Breadth Analyzer
Breadth Analyzer A special new ticker type named Breadth has been added to version 8.1 of TradingExpert Pro. Want to find out the percentage of the S & P 500 stocks at a new 52 week high AND display this as an indicator over the last 5 years? That's where Breadth Analyzer comes in. You can analyze any basket of tickers for almost any rule and display the results. Breadth tickers can be charted and or be incorporated into other screening rules. One huge benefit with this tool is the ability to create powerful and unique market timing tools.
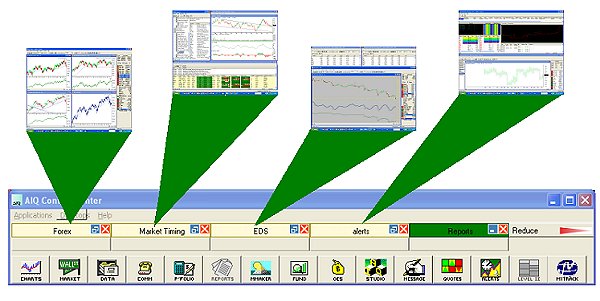
AIQ Control Center
Multiple Desktops now available using the AIQ Control Center. The AIQ Control Center gives you new power in how you control your AIQ applications.
You can create multiple desktops of AIQ applications, each desktop saves the position and colors/settings of each application. In addition to saving the layout of your AIQ applications and settings, you will also be able to switch between these desktops with one click.
Data Manager
Historical Real-Time (HRT) Downloader now in Data ManagerThe downloading and maintenance of historical real-time data has moved from RThistorical Downloader to Data Manager. This change necessitated a number of modifications to the Data Manager.
RTAlerts
RTalert real-time charts now show composite data instead of major market data.
Each RTAlert file (.RTA) now saves settings.
The indicator constant information was always saved in the .rta file, along with the list of tickers. Now colors, trendlines, indicator order, etc is saved with each file. You can have different trendlines and other attributes on the same ticker as long as they are in different .rta files. And they are saved along with the .rta.
Portfolio Manager
Portfolio Asset Allocation Pie Charts based on cost and value.
New Performance Analysis, including up to 5 benchmarks.
New Risk Analysis with Annualized IRR, Sigma, Sharpe Ratio, Treynor Ratio, Alpha, Beta and R-Squared on up to 5 benchmarks.
Test a short strategy in portfolio simulator.
Test an historical real time data strategy in portfolio simulator.
Performance Report (Monthly) – Shows the portfolio performance in terms of money flow, internal rate of return against (up to 5) benchmarks, and risk analysis for four different time periods (this month, last month, year to date, inception to date).
Portfolio simulation offers the option of using prior pass 1 results. Capitalization strategies can be changed to try different options.
|
|
