 |
Chart pattern recognition tool for TradingExpert |
| AIQs Chart Pattern Recognition is an automated chart pattern detection service that automatically identifies technical chart patterns in price charts. This service identifies dozens of new chart patterns every day across many markets, providing a trader with a host of new Trading opportunities that would otherwise go undetected. Patterns are also stored historically for back testing.
Chart patterns are well documented in technical analysis literature and are based on psychological phenomena that occur between the buyers and sellers of financial instruments in liquid markets. Pattern formations do not form a Trading system, but rather provide an indication of the future trend of a share as the price breaks key psychological barriers in the form of support and resistance lines. |
 Completed Channel Up on Wal-Mart |
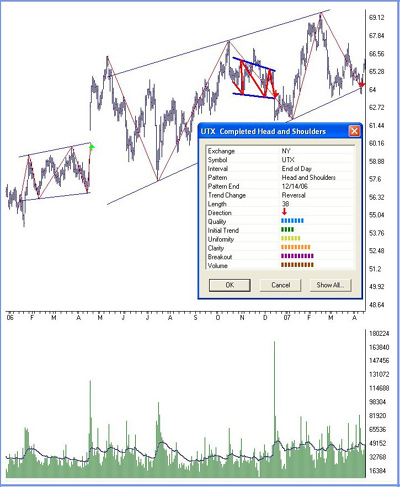
 Completed Head and Shoulders on UTX inside a completed Channel Up. A previous completed Channel Up is also visible
|
Patterns downloaded each night with your regular price data
Chart patterns are split into two main sections. Complete patterns list the pattern occurrences that have broken through either the support or resistance lines. Emerging patterns list the patterns that have not yet broken through, giving you an opportunity to be pro-active in opening a position on the market. The following chart patterns are available Currently the chart pattern engine tracks the Russell 3000 stocks, and many ETFs. |
|
An Expert System that determines the validity of the chart pattern.
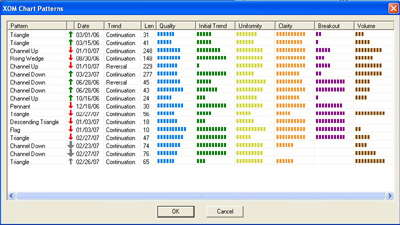
Every chart pattern includes confirming quality information to help you determine validity of the pattern including; Direction, Trend - whether this pattern is a continuation or reversal pattern. Length of the pattern in days. Quality of the pattern - this is the average of all the other quality indicators. Initial Trend Quality of the trend preceding the pattern formation. Uniformity Indicates how uniformly spaced the price turning points are that touch the support or resistance lines. Clarity How clear the pattern is. Breakout The decisiveness with which the price broke through the support or resistance line. Volume The relative amount of increase in the Trading volume at time of breakout.
|
 All the chart patterns on XOM
|

|
Fully integrated into AIQ's Trading system design tool. YES you can backtest chart patterns.
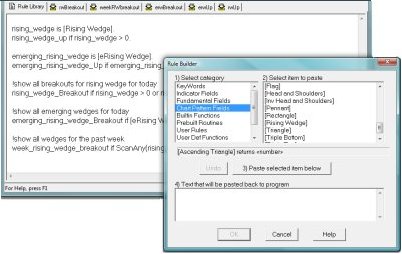
Every chart pattern, emerging or completed, including confirming quality information is available in Expert Design Studio. Now you can scan and back test Trading systems that incorporate chart patterns. When you first download chart patterns, you also receive an historical file of patterns going back over a year. Back test the validity of a pattern and run scans each day to find the patterns as they happen. We even include sample Expert Design Studio files to help you get up to speed.
|
|
Price $25/month You may cancel the service at any time by calling AIQ on 1-800-332-2999 or sales@aiqsystems.com. Chart Pattern Recognition Service is not prorated, on cancellation your service will be discontinued at the end of your month. |
Or call AIQ sales on 1-800-332-2999 for more information. |
| About Us | Products | Education | Features | |
| Home Technical Support Contact us |
TradingExpert Pro Service Levels Upgrades |
Video archive Trading Education On line manuals |
Stock Charts Trading Strategy Trading System Design |
