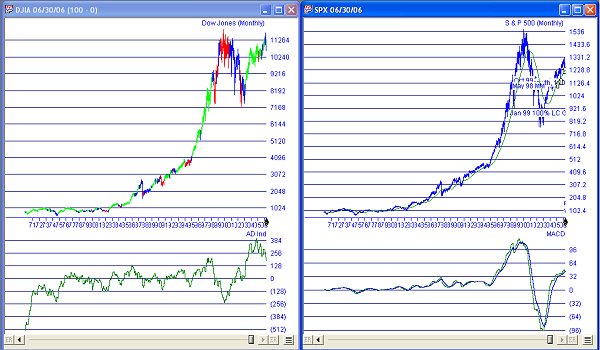
Charts  All real-time charts now show composite trades and accompanying volume. Composite data accounts for the ticker's pricing and volume from all exchanges. To view a tickers price and volume from a specific exchange, use the following exchange codes with an - sign after the ticker, e.g. IBM-M returns pricing and volume on IBm from the Midwest Exchange only. Exchange Codes P= PACIFIC X= PHILADELPHIA A= AMEX B= BOSTON T= TORONTO C= CINCINNATI M= MIDWEST S= NASDAQ N= NEW YORK Added ability to change AIQ Chart spacing down to 1, increasing the amount of data viewable in OHLC chart (previous lowest setting was 3). When exiting AIQ Charts, the currently viewed chart(s) are saved and restored when charts is opened again. To close AIQ Charts with no charts saved, press F5 before exiting. Currently viewed indicators are not saved. |
|