| |
AIQ Data Power Packs
|
|
FATI Sector Lists & Fundamental Data plus monthly IPOs |
The Ultimate Data Analysis Package is here. Find the stocks the professionals are watching and avoid those illiquid stocks with wide bid/ask spreads. Quality and Opportunity is right here. Stocks fitting the criteria are arranged into the FATIź Sector and Group Structure.
These lists contain stocks which have the following four key characteristics.
Average Daily Trading Volume > 84,999 shares
PRICE >=$1.00 & 20 DAY AVG VOLUME >=10,000 shares
Number of Analysts Ratings >= 2
Market Valuation > $99 million
Click here for a PDF overview of FATI and why it makes sense for your trading or investing.
Historical backtesting was performed over 36 four week holding periods. June 21st, 2013 through April 1st, 2016.
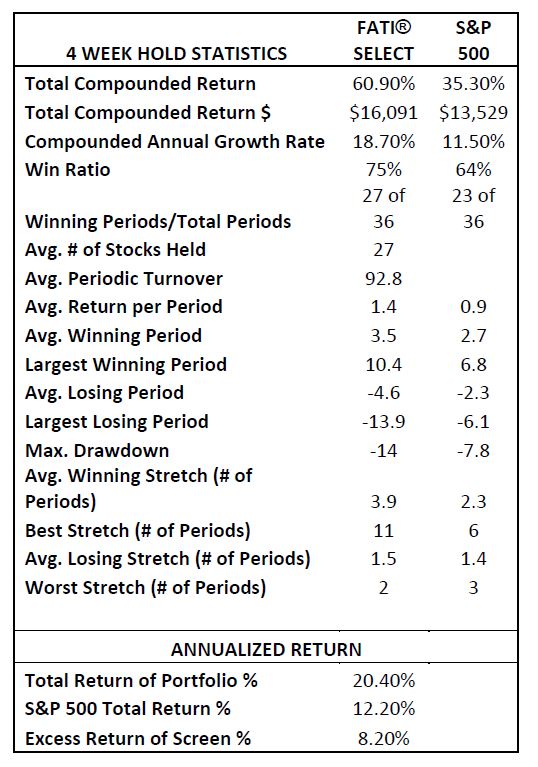
* See Performance Disclosure Below
|
FATIź Market Capitalization - Same list of stocks as in the FATIź Sector & Group list broken down by market capitalization.
|
Mega Cap > $50bn
Large Cap > $10bn < $50bn
Mid Cap > $2bn < $10bn
Small > $1bn < $2bn
Micro > $500mn < $1bn
Nano >$99mn < $500mn |
-
FATIMKTS List - The "Market Breadth" files for the six (6) FATI Market Capitalization Sectors (MegaCap to NanoCap) & the (1) FATIź Sector and group Index. This provides breadth indicators for these segements
- FATISLCT List - Monthly FATI Select List of Fundamentals Screened stocks. This is a ready to use list of fundamentally screened stocks
- Monthly IPO lists
 You hear about them in the news all the time. The latest pioneering company going 'public' and ringing the bell at the open of the NYSE. You hear about them in the news all the time. The latest pioneering company going 'public' and ringing the bell at the open of the NYSE.
There are new companies being listed every month on the US markets, stocks and ETFs you might want a slice of the action.
Now AIQ is offering a unique monthly service providing you with the AIQ list file and ticker file for these IPOs. Add them to your existing database with a simple download and quick install each month.
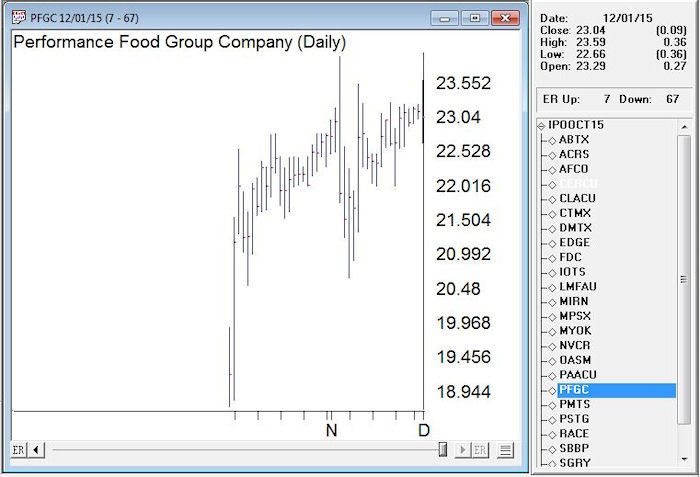
PFGC Performance Food Group Company IPO in October 2015
Keep your database up to date with the latest listing of stock and ETF IPO's from the previous month.
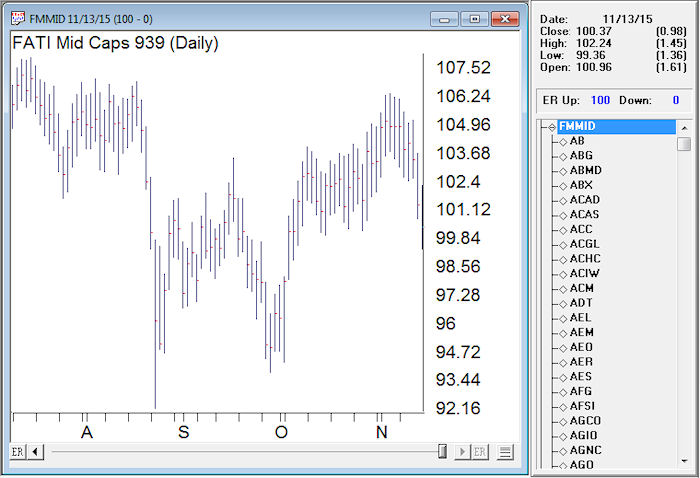
FATIź mid cap tickers
Fundamental Data - 60 fundamental data fields covering 4400 stocks.
|
Options
Shares Outstanding (mil)
Sales ($mil)
% Held by Institutions
% Held by Insiders Net
% Chg Holdings 12 Wks Market Cap ($mil)
Current Ratio
Avg Daily Vol 20 days
Beta
Avg Broker Rating
No. in Rating
% Change Completed Qtr Est - 4 wks
% Change Curr Qtr Est - 4 wks
% Change Next Qtr Est - 4 wks
% Change Curr Fiscal Yr Est - 4 wks
% Change Next Fiscal Yr Est - 4 wks
Est EPS Growth Current Year
Est EPS Growth Curr & Next Yr
Qtr EPS this Qtr/ prior qtr
Qtr EPS last Qtr/ prior qtr
Qtr EPS 2Qtrs ago/ prior qtr
Anl Sales this Yr/ Sales last Yr
2 Years Ahead Sales Growth
Cash Flow 5 Yr Avg
Div Yield
Indicated Anl Div
Payout Ratio
P/E using Curr FY Est
P/E using Next FY Est
Return on Equity
Return on Assets
Return on Investment
Inventory Turnover
Receivables Turnover
Asset Utilization
Debt/ Tot Cap
Debt/Equity Current Ratio
Market Capitalization
Quick Ratio
Cash Ratio
Interest Coverage
Cash Flow ($/sh)
Price/ Book
EV/EBITDA 12 Mo
P/E F1/ LT EPS Gr
Pretax Mgn 12 Mo
Net Mgn 12 Mo
Oper Mgn 12 Mo
Current Fiscal Yr Cons Est
# Anlst in Cons Current Fiscal Yr
Next Fiscal Yr Cons Est
# Anlst in Cons Next Fiscal Yr
Completed Quarter Cons Est
# Anlst in Cons Completed Qtr
Current Quarter Cons Est
# Anlst in Cons Current Qtr
Next Quarter Cons Est
# Anlst in Cons Next Qtr
12 Mo EPS before NRI
Piotroski Score
|

Ford display of fundamentals in AIQ Charts
Updated tickers, list and fundamental data every month
Your price will be only $29.99/mo.

SAVE $$$$$$$
Order all 3 Power Packs for one low price
$78.96.mo.
$59.97/mo.
Performance Disclosure
The performance calculations for the FATI Ultra Fundamentals were produced through backtesting
and consist of the total return (price changes + dividends) of an equal weighted portfolio.
Returns are calculated on a specified periodic basis (most often one, four or twelve weeks and
assume no transaction costs. The portfolio is rebalanced at the start of each new period. Returns
are stated as either annualized or compounded returns.
Stock trading/investing involves risk and you can lose some or all of your investment. Hypothetical
or back]tested results may not always be duplicated in the real world. Back]testing can at times
produce an unintended look]ahead bias. Results can also at times be over or understated due to
the exclusion of inactive companies. In addition, hypothetical trading does not involve financial
risk, and no hypothetical trading record can completely account for the impact of financial risk in
actual trading, not the least of which is the ability to withstand losses or to adhere to a particular
trading strategy in spite of trading losses. These are material points which can also adversely affect
actual trading results. The back]tested results prepared for the FATI Ultra Fundamentals consisted
of only active companies.
Potential Limitations in Backtesting
There are four types of biases which may distort back]test results.
1. Look Ahead bias ] this occurs when the stocks selected on a rank date use financial information
that was not available on that rank date. For example: if a company reports its financials for the
quarter ending Mar 2006 on Apr 20, 2006, the rank that is created at the end of the March 2006
quarter should not use the financials for that quarter, since they were not available at the end of
the quarter.
2. Restatement bias ] this occurs when a company restates its historical financials. For example: if
a company reports its 3/16 results and restates its Dec 2015 results; a rank done as of end of Dec
2015 should use the originally reported financials for Dec 2015, not the restated financials for Dec
2015 which were not available until March 2016.
3. Survivor bias ] this occurs when stocks that have been delisted or acquired are not included in
the back]test results. Depending on your strategy, the impact of survivor bias on the back]test
may or may not be significant.
4. Split bias ] this can occur if your screen uses price as a qualifier, e.g., Price > $5.00. The database
is split adjusted. So, using the example above, if the company had a stock split between the
screened date and the date of the back]test, the company may not be included in the back]test
results if the split adjustment caused the historical price at the date of the back]test to be below
that $5.00 threshold. Typically, stock splits occur at higher prices.
|
|