How effective is the strategy?
 With this strategy, in every case, the “strong”
groups outperformed the “weak” groups between 1993 and 2003. However, on a year-by-year basis there was no predictable pattern (looking at rolling 12-month returns for all of these tests, “strong” groups outperformed 57% of the time, “weak” groups outperformed about 43% of the time). Additionally, the standard deviation of annual returns for “weak” groups was significantly less (generally 40 to 50% lower) than that of “strong” groups. In other words, while the “strong” groups generated the
higher gross returns, the “weak” groups generated higher risk adjusted returns. This trade-off in performance is another reason why it makes more sense to combine
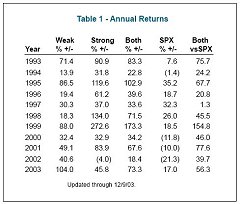
these two strategies and thus get the best of both worlds – high long-term returns from strong groups and dependable annual returns from weak groups. Table 1 shows the annual returns.
|
 With this strategy, in every case, the “strong”
groups outperformed the “weak” groups between 1993 and 2003. However, on a year-by-year basis there was no predictable pattern (looking at rolling 12-month returns for all of these tests, “strong” groups outperformed 57% of the time, “weak” groups outperformed about 43% of the time). Additionally, the standard deviation of annual returns for “weak” groups was significantly less (generally 40 to 50% lower) than that of “strong” groups. In other words, while the “strong” groups generated the
higher gross returns, the “weak” groups generated higher risk adjusted returns. This trade-off in performance is another reason why it makes more sense to combine
these two strategies and thus get the best of both worlds – high long-term returns from strong groups and dependable annual returns from weak groups. Table 1 shows the annual returns.